The Aspen real estate market closed 2025 in an unambiguous position of strength. Total dollar sales volume climbed 38% to $2.51 billion. The single-family median price reached $17.5 million, up 31% year over year. And for the first time in the market’s recorded history, properties selling above $20 million became not the exception but the defining feature of an entire year.
Then came Q1 2026, and the market exhaled. Sales volume pulled back sharply, producing the lowest first-quarter performance since 2020. March 2026 closed transactions fell 50% compared to March 2025. Snowmass Village saw a 46% decline in closings over the same period.
Let’s discuss what happened, what it means, and what it signals for the rest of 2026.
2025 in Review: A Year Defined by Ultra-Luxury
The 2025 Aspen market delivered figures that would have been difficult to forecast even three years ago.
KEY 2025 Aspen Market Metrics
Metric | 2025 Figure | Change vs 2024 |
Total combined dollar volume | $2.51 billion | +38% |
Aspen single-family home median | $17.5 million | +31% |
Aspen condo median | $3.175 million | +11% |
Snowmass Village single-family median | $8.25 million | +11% |
Sales above $20 million | 42 transactions | +62% (from 26) |
$20M+ share of total dollar volume | 57% | Up from ~40% |
Total Aspen residential sales | 182 | +2% (from 179) |
Sales above $6,000/SF | 12 | Up from 6 |
Sales above $7,000/SF | 4 | Up from 1 |
This was not broad-market price inflation across all segments. It was a market that became increasingly stratified, with exceptional properties commanding record premiums while more average offerings faced longer timelines and pricing pressure.
Aspen Total Dollar Sales Volume, 2021-2025
Year | Total Combined Dollar Volume | Year-over-Year Change |
2021 | $3.80 billion | Peak year |
2022 | $3.10 billion | – 18% |
2023 | $3.10 billion | Flat |
2024 | $1.82 billion | -41% |
2025 | $2.51 billion | +38% |
What Happened in Q1 2026
The pullback in early 2026 was sharp enough to warrant direct explanation. According to the Q1 and March 2026 Estin Report, published April 3, 2026, three overlapping forces converged to suppress transaction activity:
A Historically Poor Ski Season
Aspen experienced record-setting low snowfall and drought conditions through January and February 2026. When the skiing is poor, buyer energy in Aspen drops measurably. The relationship between mountain conditions and transaction activity is well-documented across multiple market cycles.
Macroeconomic and Geopolitical Uncertainty
The Estin Report specifically cites tariff controversies, Federal Reserve policy debates, and escalating geopolitical tensions as factors placing high-net-worth buyers in a wait-and-see mode. Clients at this wealth level can delay a discretionary acquisition indefinitely without financial consequence.
An Extraordinarily High Comparison Base
Q1 2025 was exceptionally strong. Comparing Q1 2026 against it produces a decline that is arithmetically dramatic but contextually misleading.
Aspen Monthly Closed Sales Count, Selected Months 2024-2026
Month | Closed sales | Notes |
March 2024 | 18 | Baseline reference |
June 2024 | 22 | Peak spring activity |
December 2024 | 21 | Strong year-end close |
March 2025 | 24 | High comparison base |
June 2025 | 25 | Peak of record year |
December 2025 | 22 | Stable year-end |
January 2026 | 10 | Q1 2026 pullback begins |
February 2026 | 11 | Continued softness |
March 2026 | 12 | -50% vs. March 2025 |
Neighborhood Price Breakdown: Where Values Stand in 2026
Aspen’s market is hyperlocal. A single headline median price understates the divergence between neighborhoods. Here is where values stood entering 2026, broken down by submarket:
Central Core
The most liquid submarket in the Roaring Fork Valley. Average sale prices climbed from approximately $6.3 million in 2024 to $8.5 million in 2025. Condo prices per square foot in the Central Core run approximately $500 higher than those in surrounding Aspen neighborhoods. Properties in short-term rental permitted zones transact faster and command a measurable premium.
Red Mountain
Red Mountain averaged $22.38 million in 2025, down from $32.09 million in 2024. The decline does not reflect a fall in desirability. It reflects a shift in composition: the 2024 average was skewed by the $108 million sale at 419 Willoughby Way, which remains the highest residential sale in Aspen’s recorded history. Red Mountain is still where the market’s most significant estate-scale transactions occur.
West End
Large lots, historic streetscapes, and quiet proximity to downtown define the West End. Several top-end sales set records in 2024, including the $59.75 million Lake Avenue property. Buyers here tend to prioritize town access without town density and lot scale over square footage.
East Aspen
East Aspen moved from a $10.25 million average to $11.96 million in 2025. It draws buyers who want access to the Roaring Fork River corridor and more land per dollar than the Central Core. It also has meaningful development potential for buyers with a longer landhold horizon.
Snowmass Village
Snowmass is closing the price gap with Aspen more quickly than most market observers expected. The single-family median reached $8.25 million in 2025, up 11% year over year. The condo median pulled back 20% to $2.09 million, reflecting pricing adjustments rather than demand weakness. For buyers open to the broader Roaring Fork Valley, Snowmass presents a genuinely compelling entry point.
Average Sale Price by Neighborhood, 2024 VS. 2025
Neighborhood | 2024 Avg. Sale Price | 2025 Avg. Sale Price | Change |
Red Mountain | $32.09 million | $22.38 million | -30% |
West End | ~$15.00 million | ~$16.00 million | +7% |
Snowmass Village (SFH) | $7.40 million | $8.25 million | +11% |
East Aspen | $10.25 million | $11.96 million | +17% |
Central Core | $6.30 million | $8.50 million | +35% |
The Supply Constraint: Why Inventory Will Not Meaningfully Recover
Aspen’s most durable investment thesis rests on a structural argument, not a cyclical one. The supply constraint is permanent by design, and here are reasons why:
- Inventory is still about 40% below December 2019 levels. That gap has remained for five years, with no clear path to recovery.
- New construction costs $2,000 to $4,000 per square foot before soft costs, design review, and carrying risk. At that level, only top-tier spec projects make financial sense.
- The City of Aspen allows as few as six demolition permits a year. That slows the teardown-and-rebuild cycle that helps replenish inventory in markets like Vail and Breckenridge.
- Pitkin County’s updated land use code, effective January 2026, adds more regulatory complexity and further tightens the development pipeline.
- More than 70% of Aspen sales close in cash, so most owners face no mortgage pressure to sell and can hold indefinitely.
As of January 2026, Pitkin County had approximately 151 active residential listings and 9.4 months of supply, up from 4.5 months a year earlier. That looks looser on the surface. But inventory at 40% below the pre-pandemic baseline is not a buyer’s market by any reasonable definition.
Aspen Active Residential Listing Trend, 2019-2026
Period | Approx. Active Listings | Notes |
December 2019 | ~250 | Pre-pandemic baseline |
Q2 2020 | ~210 | Early pandemic decline |
Q4 2020 | ~155 | Continued drawdown |
Q2 2021 | ~110 | Demand surge absorbs supply |
Q4 2021 | ~90 | Near historic low |
Q2 2022 | ~82 | Lowest point recorded |
Q4 2022 | ~95 | Slight recovery |
Q2 2023 | ~115 | Gradual rebuild |
Q4 2023 | ~130 | Slow improvement |
Q2 2024 | ~140 | Still well below baseline |
Q4 2024 | ~148 | Modest increase |
January 2026 | ~151 | 40% below Dec 2019 baseline |
The Buyer Profile Driving the Market
The billionaire presence in Pitkin County is now among the largest concentrations per capita of any market in the world. An estimate presented at the Aspen Board of Realtors in March 2026 put the number of billionaires owning property in Pitkin County at 200 to 225, up from a prior estimate of 100 to 125. That upward revision confirms continued concentration, not dilution.
This buyer profile produces several behaviors that define the market:
- Many buyers acquire with a compound mindset, purchasing the main estate, nearby lots, staff condos, and sometimes commercial property at the same time.
- Privacy is non-negotiable, which is why off-market deals still dominate the highest-value segment.
- These buyers are mostly insulated from mortgage rate swings, unlike buyers in most other U.S. housing markets.
- Fractional ownership interest rose year over year in 2025, showing demand for Aspen access without the commitment of full-time ownership.
What the Data Signals for the Rest of 2026
The remainder of 2026 is more uncertain than the prior two years, but structurally more attractive than most other luxury markets in the country.
The Case for Continued Price Stability:
- The supply shortage is structural, not cyclical. Properties cannot be built fast enough to match absorption.
- The buyer pool is cash-heavy, globally diversified, and less affected by U.S. credit conditions.
- Several large spec homes on Red Mountain are moving ahead in 2026, with projected prices above $30 million, signaling confidence at the top end.
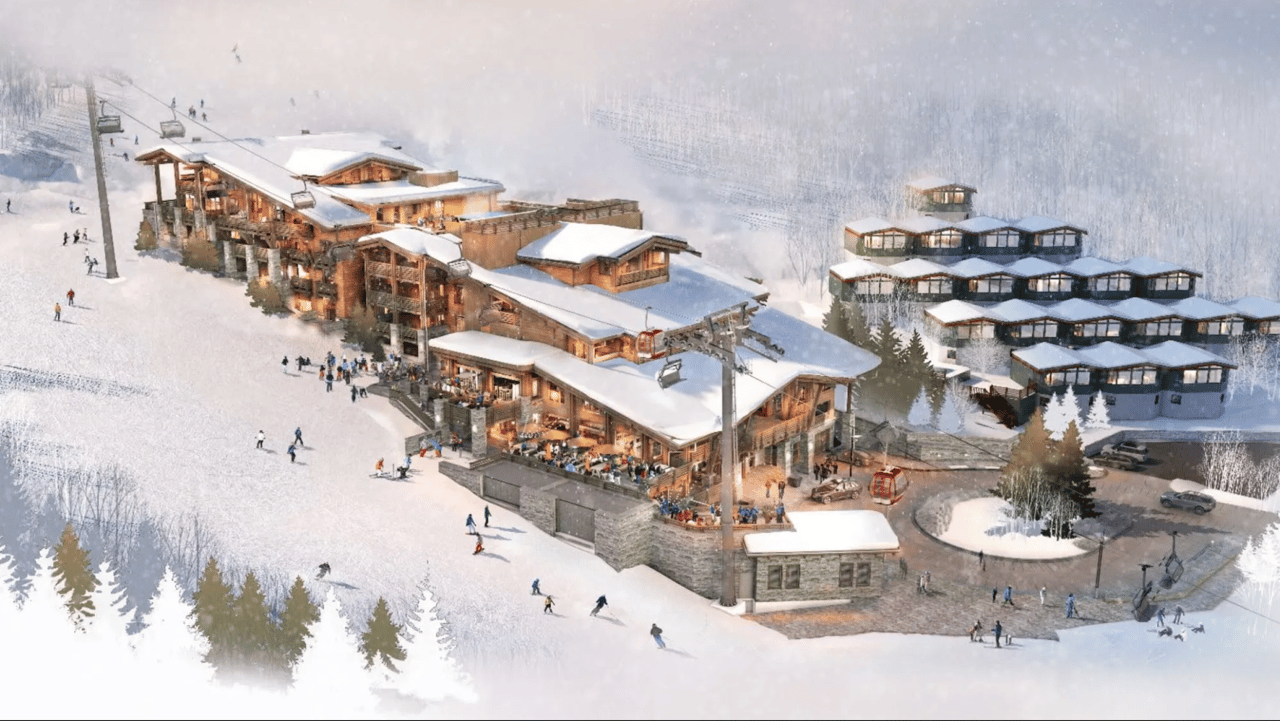
- The Lift One Corridor project at the base of Aspen Mountain is expected to make real progress this year, potentially creating the biggest new luxury zone since Snowmass Base Village.
- In prime areas, price per square foot remains above $4,000 and has not meaningfully declined.
The Risks Worth Monitoring:
- Macro uncertainty, including tariffs and geopolitical risk, could keep high-net-worth buyers in wait-and-see mode beyond Q1.
- New 2025 property tax assessments take effect in the 2026–2027 tax year, adding carrying costs that may influence hold-or-sell decisions.
- Short-term rental permits do not transfer at sale, which affects how buyers in some zones value investment potential.
- A broad decline in equity portfolios could reduce discretionary wealth, though Aspen has historically been more insulated than most markets.
What Buyers and Sellers Should Do Now
For buyers, the Q1 2026 softness is worth taking seriously—not as evidence of decline, but as a brief window. The properties that define Aspen’s upper market do not wait for public listing, and the conditions supporting long-term value have not changed.
For buyers
- Start early. The best homes in the $15M to $50M range trade through broker relationships, not listing portals.
- Consider Snowmass Village as a lower-entry option with real upside, especially if location is flexible.
- Review the regulatory timeline for any renovation or redevelopment plan. Aspen permitting takes planning.
- Cash readiness matters. More than 70% of deals close without financing, and sellers at this level do not wait for loan approval.
For sellers
- Homes priced to current comps are still selling. Homes priced to past peak expectations are sitting longer.
- The off-market path still works for sellers who need discretion and have access to qualified buyers. It does not replace realistic pricing.
- The 2026 regulatory environment is more complex. Sellers who completed structural or exterior work without permits should address that before listing.
Explore Aspen luxury real estate, browse Aspen homes for sale, or learn more about Ksenia.
Frequently Asked Questions
Is Aspen real estate a good investment in 2026?
Aspen real estate still has a strong long-term investment case for buyers who enter at the right price and plan to hold. Supply remains limited, demand is supported by global wealth rather than local market cycles, and the billionaire presence in Pitkin County continues to grow. There may be short-term timing risk in 2026, but the long-term fundamentals remain strong.
Will Aspen home prices fall in 2026?
Current data does not point to a price decline. Prices stayed firm through 2025 and have remained steady in early 2026, even as sales volume slowed. The softer Q1 2026 market reflects fewer deals, not lower prices. In January 2026, the single-family median sale price reached $22.75 million, up 82% year over year, though that jump was driven more by the mix of homes sold than by a broad market-wide surge.
How is Q1 2026 affecting the Aspen real estate market?
Q1 2026 posted the lowest first-quarter transaction volume since 2020. Several factors likely contributed, including a weak ski season, broader macro uncertainty, and a tough comparison against an unusually active Q1 2025. Most brokers see this as a temporary pause, not a structural shift, and expect activity to normalize through the rest of 2026.
What neighborhoods in Aspen have the highest property values?
Red Mountain continues to post the highest average sale prices in Aspen, with an average of $22.38 million in 2025. The West End and Central Core also rank among the most expensive areas. Central Core offers stronger liquidity, while the West End tends to appeal to buyers seeking larger lots and more privacy.
How do I access off-market properties in Aspen?
Most off-market properties above $10 million never appear on public listing sites. Access depends almost entirely on broker relationships. The best way in is to work with a broker who is already connected to the private networks where these deals happen and to build that relationship before you are actively ready to buy. For off-market opportunities, visit insideraspen.com to request the list.