|
|
|
ASPEN REAL ESTATE
SPRING 2025
|
|
|
|
|
|
(click on the images throughout this email to see the listings)
July 2, 2025
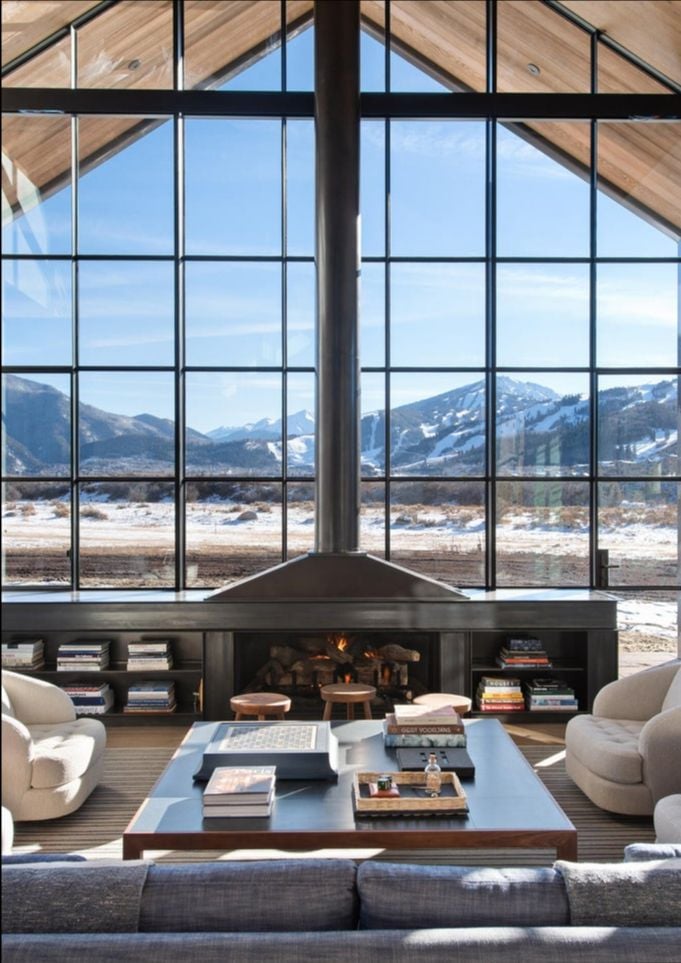
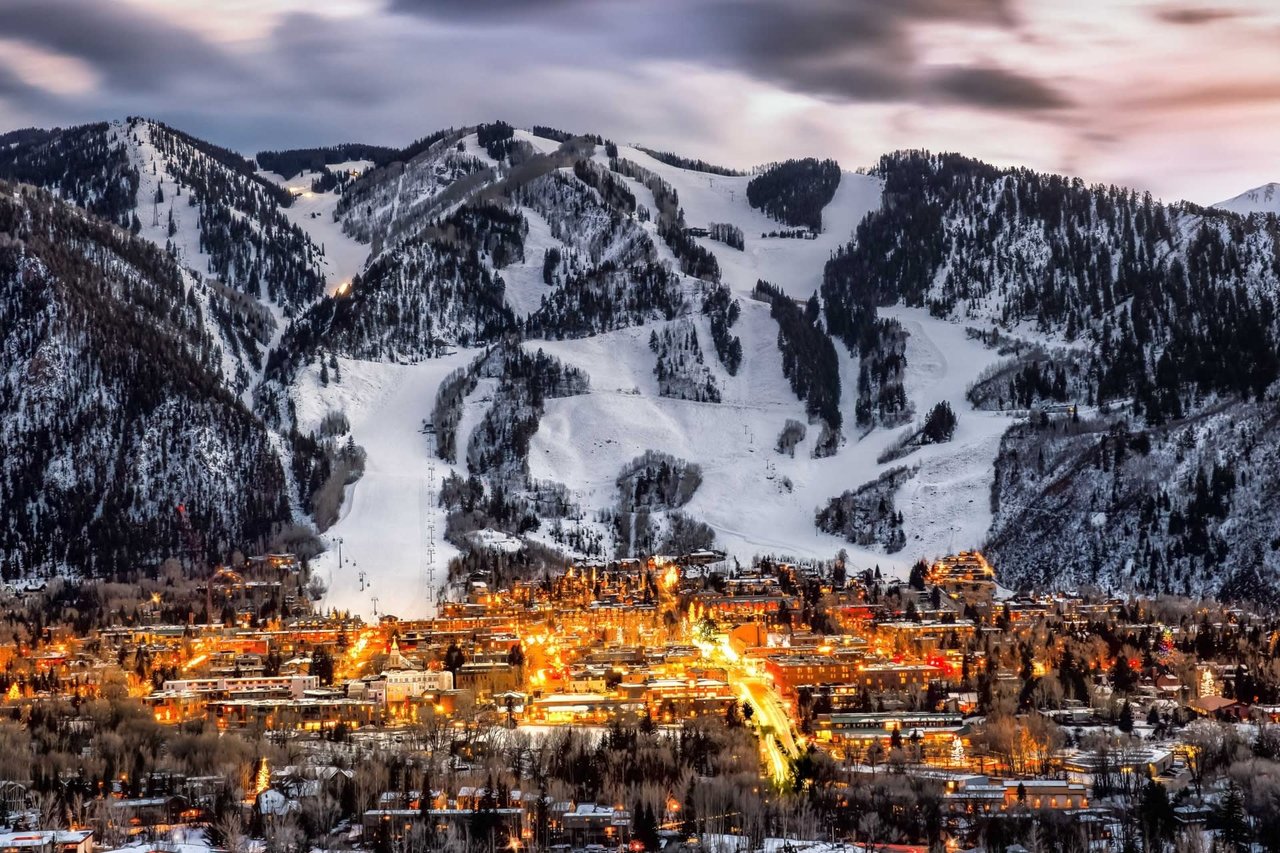
Is now the best time to sell your home in Aspen?
To answer that question, we will go over the 2024 Annual Review (as of March) from Aspen’s leading appraiser. We’ll also examine this spring’s market activity and explore a discreet strategy to test the market for your home— while maintaining your privacy.
|
|
|
|
2024 marked a spectacular rebound for Aspen real estate, achieving $3.8 billion in total sales volume—a 20% increase from 2023's $3.1 billion and the third-highest year ever recorded. This performance approached the record years of 2021 ($4.645 billion) and 2020 ($4.2 billion), driven by unprecedented luxury sales and new inventory absorption.
-
Total Sales Volume: $3.8 billion (up 20% from 2023)
-
Number of Transactions: ~900 sales (consistent with 2022-2023)
-
Historical Context: Only 2020 and 2021 exceeded 2024's performance
-
Market Driver: Sales over $20 million and Base Village new construction
|
|
|
|
|
|
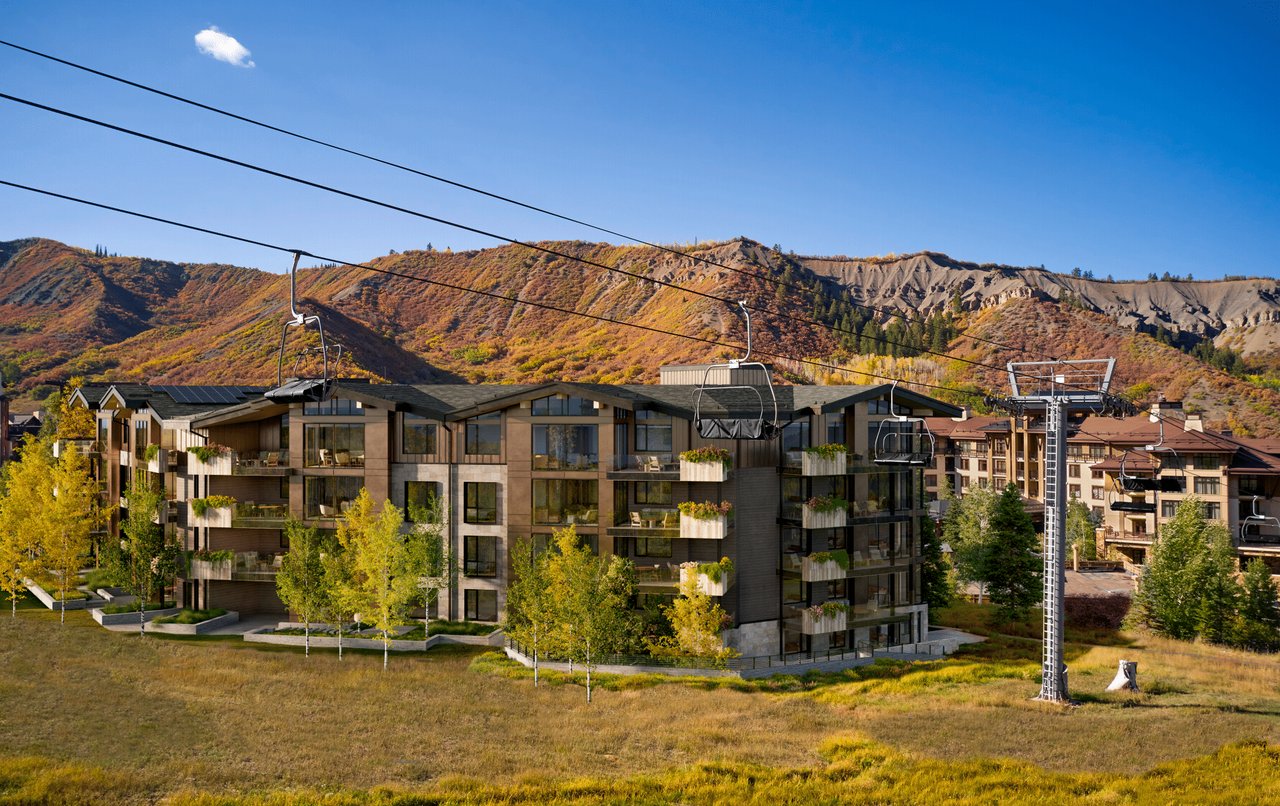
The Aspen condominium market maintained its premium positioning with healthy fundamentals despite a modest decline in volume.
Market Performance
-
Dollar Volume: $343 million (down from $361M in 2023)
-
Median Price: $2.95 million (+7% from 2023)
-
Average Price: $3.8 million (down 8% from $4.15M in 2023)
-
Price Per Square Foot: $3,200 (up from $2,800 in 2023)
Sales Activity Analysis
-
Total Sales: 90 units
-
80 sales over $2,000/sq ft (89% of total)
-
52 sales over $3,000/sq ft
-
9 sales between $4,000-$5,000/sq ft
-
4 sales over $5,000/sq ft
Historical Price Records
-
All-Time Per Sq Ft Record: $7,545/sq ft (Monarch on the Park P2, 2022, $25.875M)
-
2024 Highest: $6,905/sq ft (Connor Cabins townhouse, off-market sale)
$10M+ Market Performance
Current Record Holder: Motherlode Penthouse at $47.9 million (2023)
Inventory Dynamics
-
Year-End Listings: 66 units (vs. 61 in 2023)
-
Historical Context: Pre-COVID inventory typically 90-130 units
-
Market Condition: 6-12 months supply (strong seller's market)
-
Trend: Seller's market since 2017
|
|
|
|
|
|
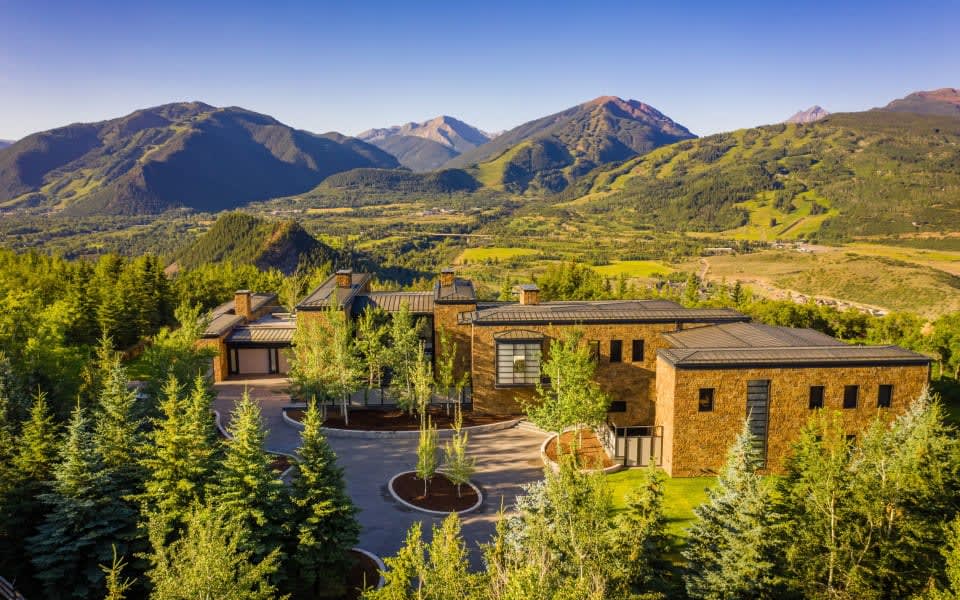
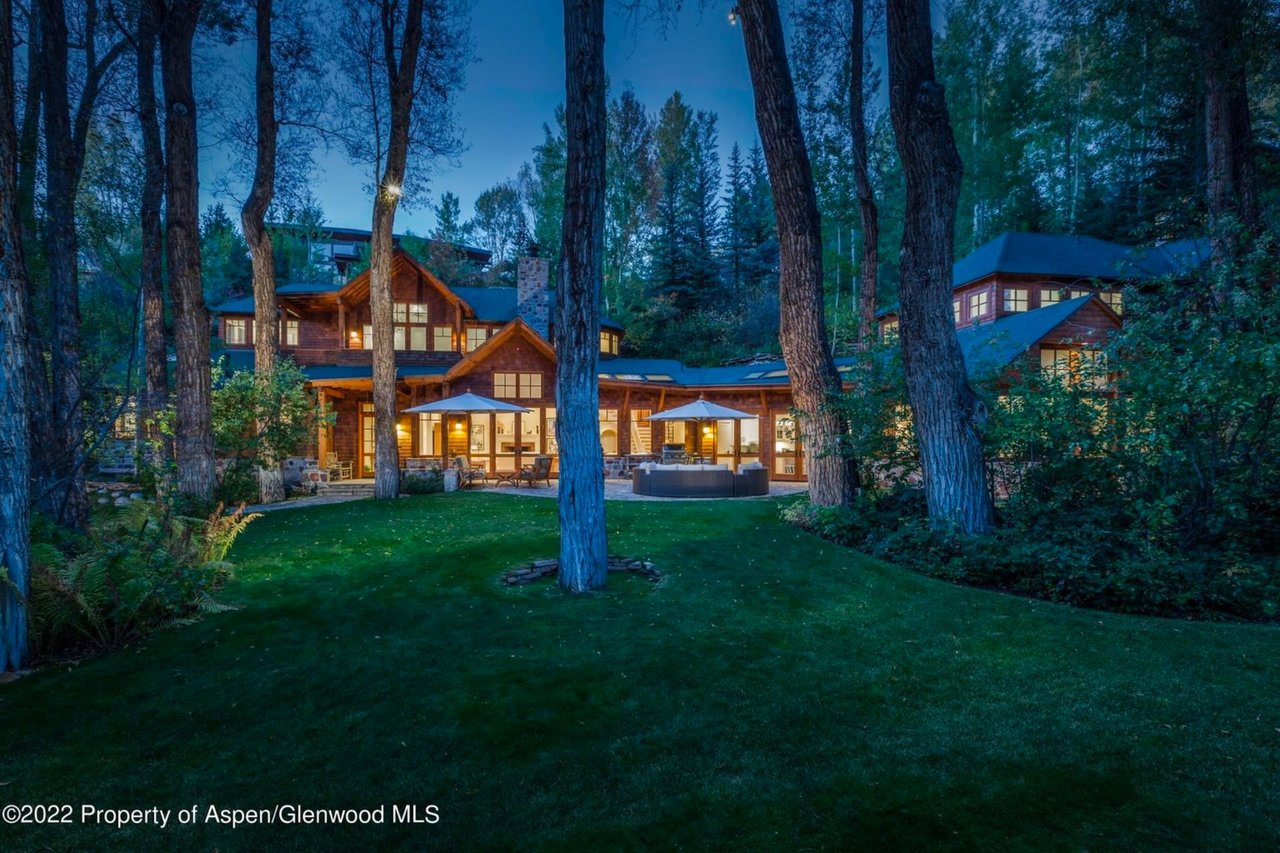
2024 achieved record-breaking average pricing while demonstrating a complete transformation to the ultra-luxury market.
Core Performance Metrics
-
Sales Volume: $1.13 billion (down 10% from 2023)
-
Number of Sales: 54 homes (down 24% from 71 in 2023)
-
Average Price: $21 million (highest ever recorded)
-
Median Price: $16.75 million (up from $13M in 2023)
-
Price Per Square Foot: $3,300 (up from $2,900 in 2023)
Ultra-Luxury Market Dominance
$10M+ Sales Concentration: 70-80% of all house sales (2022-2024 consistent)
$20M+ Sales Impact: One in every three sales exceeded $20 million
Neighborhood Price Analysis (Price Per Square Foot)
-
Central Core: $5,900/sq ft average (3 sales)
-
West End: $4,000/sq ft average
-
Red Mountain: $4,000/sq ft average
-
Pitkin Creek: $4,000/sq ft average
-
Smuggler Area: $1,900/sq ft
Most Active Neighborhoods (2024)
-
West End: 12 sales
-
East Aspen: 11 sales
-
West Aspen: 11 sales
Historical Price Evolution
-
2022: $20M average, $14M median
-
2023: $17M average, $13M median (17% decline)
-
2024: $21M average, $16M median (record highs)
|
|
|
|
|
|
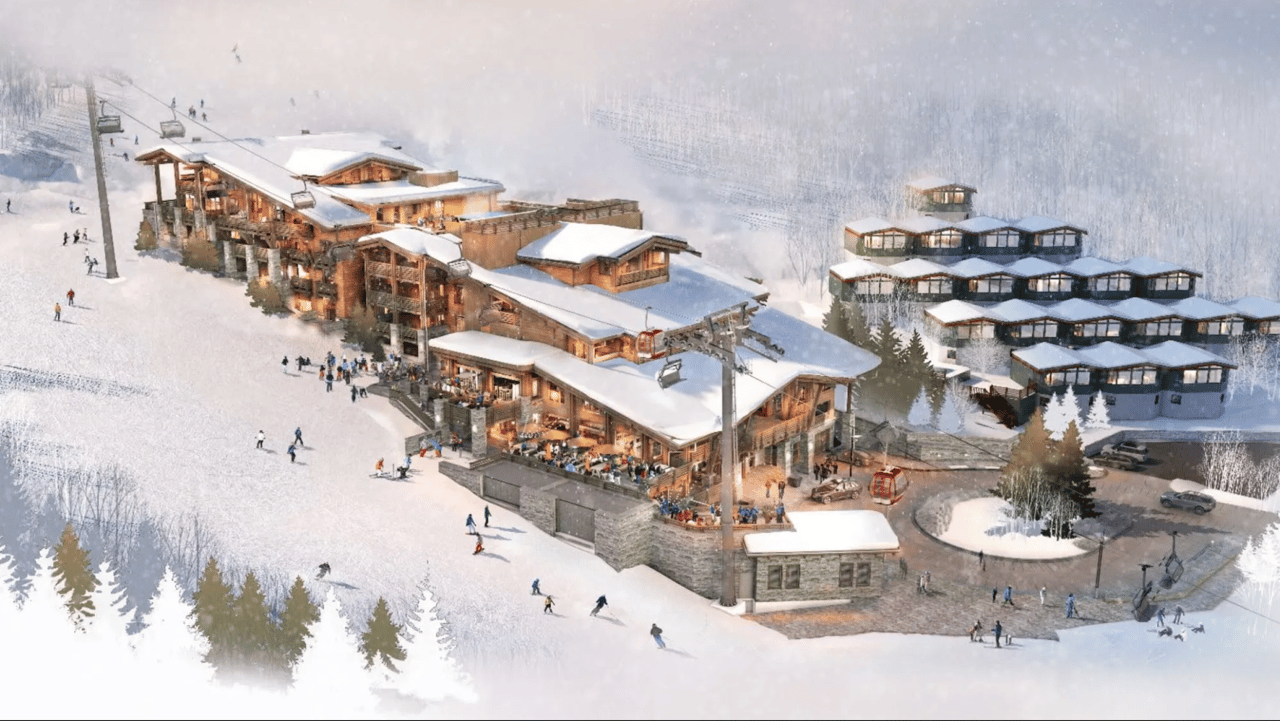
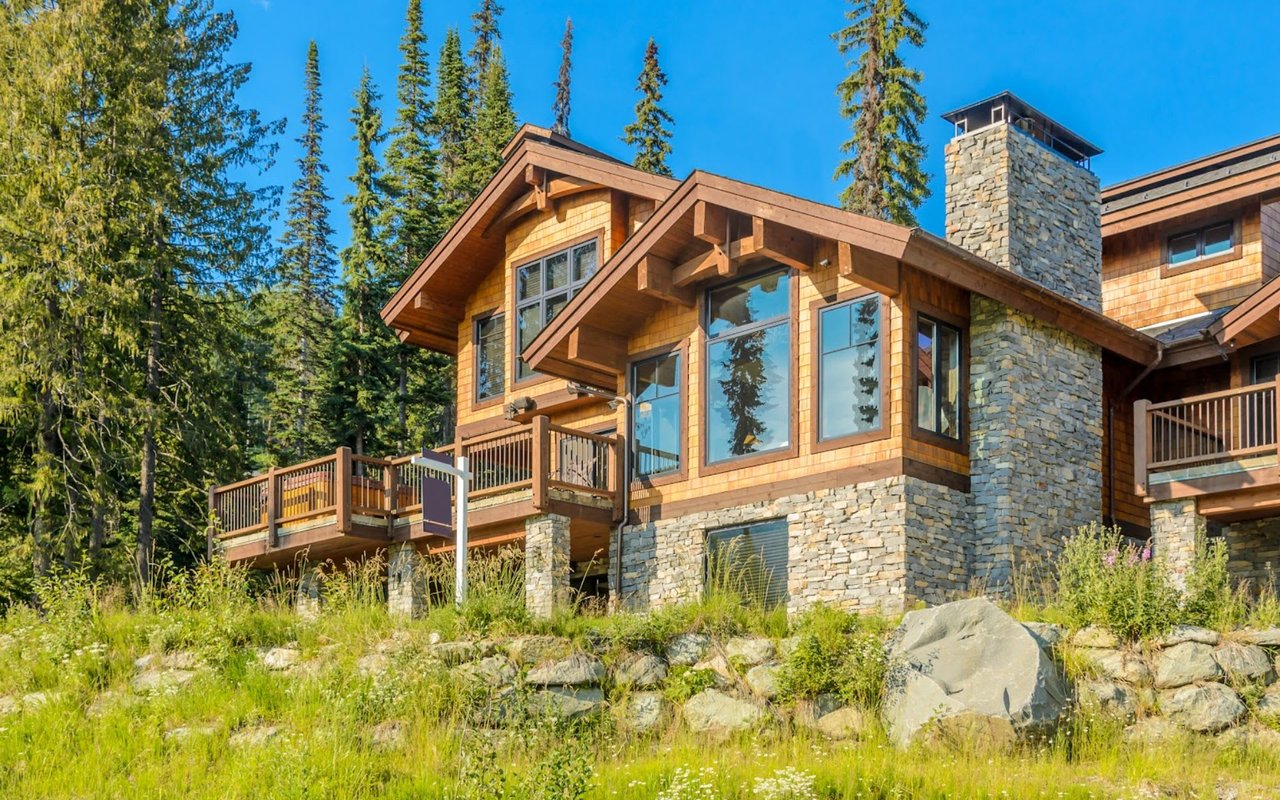
2024 marked the most extraordinary year in Snowmass condominium history, with new Base Village developments completely transforming market dynamics.
Volume and Transaction Data
-
Total Dollar Volume: $680 million (doubled from 2023)
-
Number of Sales: 178 units (+23% from 2023)
-
Average Sale Price: $3.8 million (essentially doubled from 2023)
-
Median Price: $2.7 million (+50% from 2023)
Base Village Impact
Historic Price Milestones
Previous Record: $9 million (Lumen and Havens units)
2024 Breakthrough: Nine sales exceeded $10 million (all in Aura)
Record-Breaking Sales:
-
Aura 501 Penthouse: $11.9 million (October 2024, under contract since 2022)
-
Ultimate Record: $15 million (November 2024) at $5,027/sq ft
-
Price Per Square Foot Record: $5,027/sq ft
Market Transformation Metrics
-
Price/Sq Ft Evolution: $650 (2015) → $2,200 (2024) = 238% increase over 10 years
-
Premium Sales Activity: 92 sales over $2,000/sq ft (vs. 22 in 2023)
-
Ultra-Premium: 36 sales over $3,000/sq ft, including 5 over $4,000/sq ft
Current Inventory
-
Year-End Listings: 142 units (+25% from 2023)
-
Stratos Component: 89 of 142 listings (63% of inventory)
-
Market Absorption: Strong with majority of new inventory pre-sold
|
|
|
|
|
|
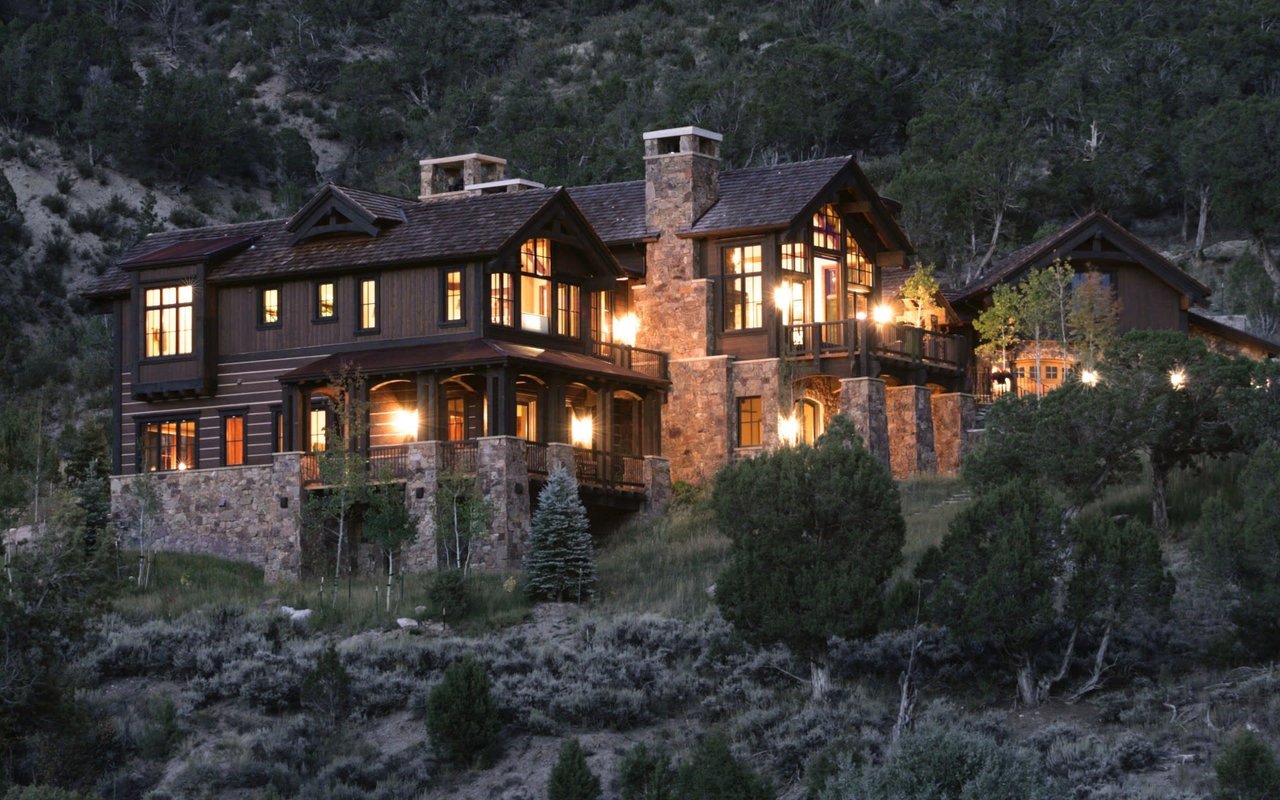
The Snowmass house market demonstrated remarkable strength with dramatic price appreciation despite lower transaction volumes.
Performance Metrics
-
Sales Volume: $273 million (+11% from 2023, second-highest ever)
-
Number of Sales: 28 homes (down from peak of 72 in 2021)
-
Average Price: $9.75 million (+34% from 2023)
-
Median Price: $8.45 million (up from $5.5 million in 2023)
-
Price Per Square Foot: $1,950 (up from $1,600 in 2023)
Market Segmentation
-
$5M+ Sales: 85% of all transactions (vs. 60% in 2023)
-
$10M+ Sales: 12 transactions (highly impressive volume)
-
Sub-$5M Market: Essentially non-existent
Market Positioning
|
|
|
|
ASPEN Ultra-Luxury Market Deep Dive
$10 Million+ Sales Analysis
-
2019: 25 sales (baseline)
-
2020: 75 sales (+200% increase)
-
2021: 76 sales (peak volume)
-
2022: 62 sales
-
2023: 59 sales
-
2024: 56 sales
-
20-Year Average: 28 sales (2024 = 200% above long-term average)
$20 Million+ Market Explosion
Pre-2020 Norm: 1-3 sales annually over $20M
2020-2024 Average: 21+ sales annually
Year-by-Year $20M+ Sales
-
2020: 22 sales
-
2021: 22 sales
-
2022: 23 sales
-
2023: 20 sales
-
2024: 22 sales
2024 Ultra-Premium Breakdown
Supply Analysis: Year-End 2024 VS Now
-
$10M+ Listings: 89 properties VS 115
-
$10M+ Inventory: 12-18 months supply
-
$20M+ Listings: 47 properties VS 56
-
$20M+ Inventory: 24-30 months supply
|
|
|
|
|
|
The Billionaire Impact
Estimated Local Billionaire Population: 100-120 property owners
Market Context: 16,000 total properties countywide
Global Comparison: Rivals New York (110), Moscow (74), Hong Kong (74) in concentration
Economic Impact Perspective
-
$1 Billion spending at $1/second: 32 years to exhaust
-
$100 Million spending at $1/second: 3 years to exhaust
-
Market Pricing Power: Ability to pay $5-10M premiums without material impact
|
|
|
|
|
|
Given the limited new construction in Aspen and a continued emphasis on remodeling existing properties, along with the conclusion of new development projects in Snowmass, future inventory of new homes is expected to remain constrained. This scarcity supports ongoing price appreciation for larger, newer homes.
In Aspen’s ultra-luxury segment, approximately 70–80% of sales exceed $10 million, while Snowmass now offers virtually no inventory under $5 million—reflecting its evolution into a bona fide luxury destination.
With both buyers and sellers now acclimated to the current interest rate environment, we are seeing a gradual increase in available listings.
While recent geopolitical developments and tariff concerns have prompted some buyers to pause, the financial markets continue to reach new highs. This, in turn, is expected to renew buyer confidence and activity in the near term.
If you are curious about how much your home is worth without listing it, scroll down below to learn more.
Historical Market Context
Record Performance Years
-
2021: $4.645 billion (1,500+ sales)
-
2020: $4.2 billion
-
2024: $3.8 billion (900 sales)
Long-Term Trends
-
Volume Consistency: 2022-2024 averaging 900 sales annually
-
Price Appreciation: Dramatic increases across all segments
-
Market Evolution: Transformation from seasonal to year-round luxury destination
-
Buyer Profile: Ultra-high-net-worth dominance established
|
|
|
|
Spring in Aspen is traditionally considered the off-season, with many businesses closed and few buyers in town. Yet, it was remarkable to witness four sales exceeding $40 million—three of them occurring off-market—during what is typically the quietest time of year.
|
|
|
|
1763/1765 McLain Flats Rd Sold in May
$41M | 21 acres
The price was for two large lots on McLain Flats and included plans to build two 15,000 sq ft homes. Hansen quoted the build costs for both homes to be around $100M last year.
400/410 Lake Ave
$52.5M | $7,000/sq ft | Sold in June
7,500 sq ft | 7 beds | 7 baths | 34,000 sq ft lot | Built in 1996
See previous sale here, where it sold for $30 million just four years ago, despite no changes to the existing structures. This home sits on a large private lot overlooking the Hallam Lake that can never be developed, which is why the homes on this street trade at such a high premium.
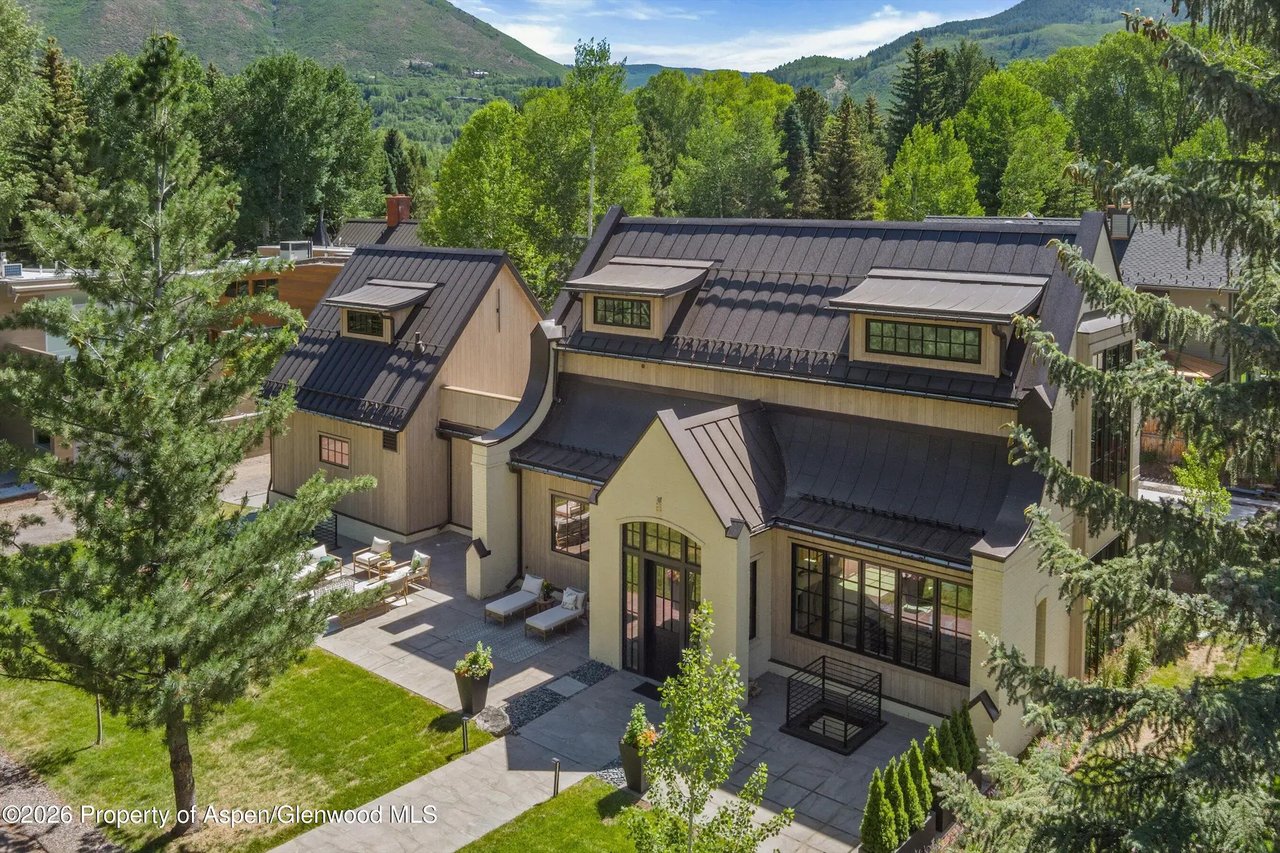
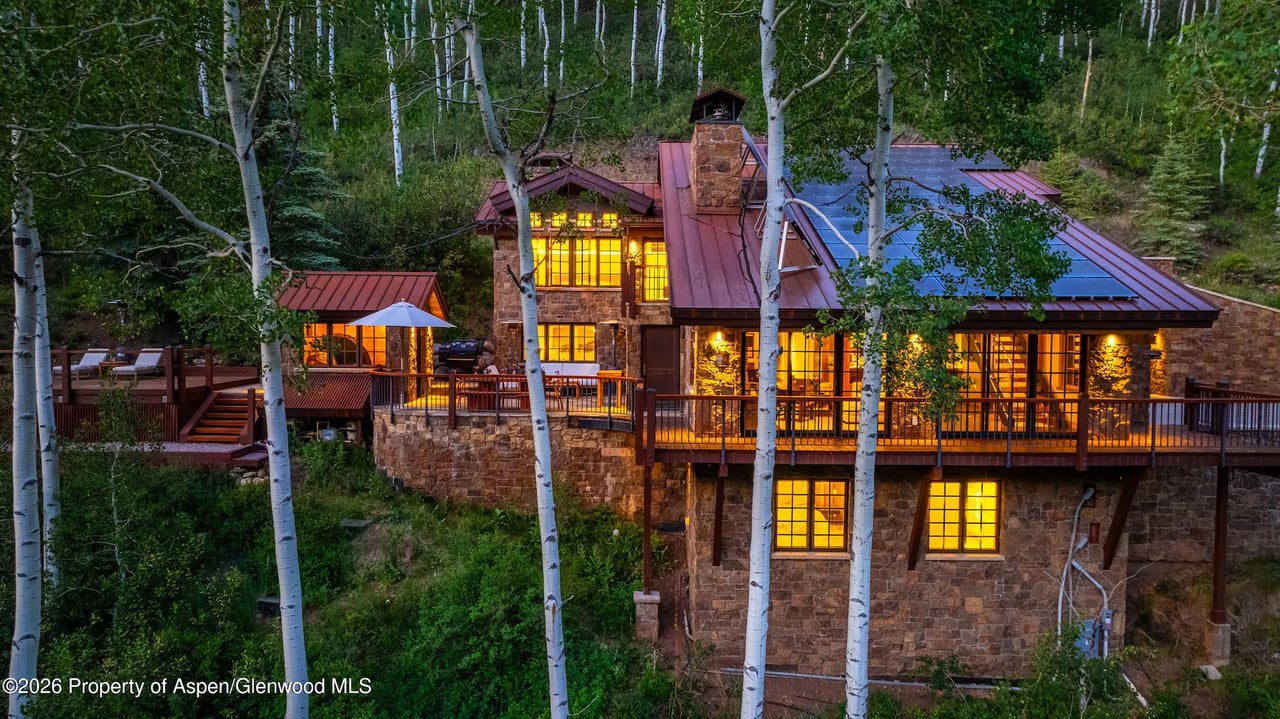
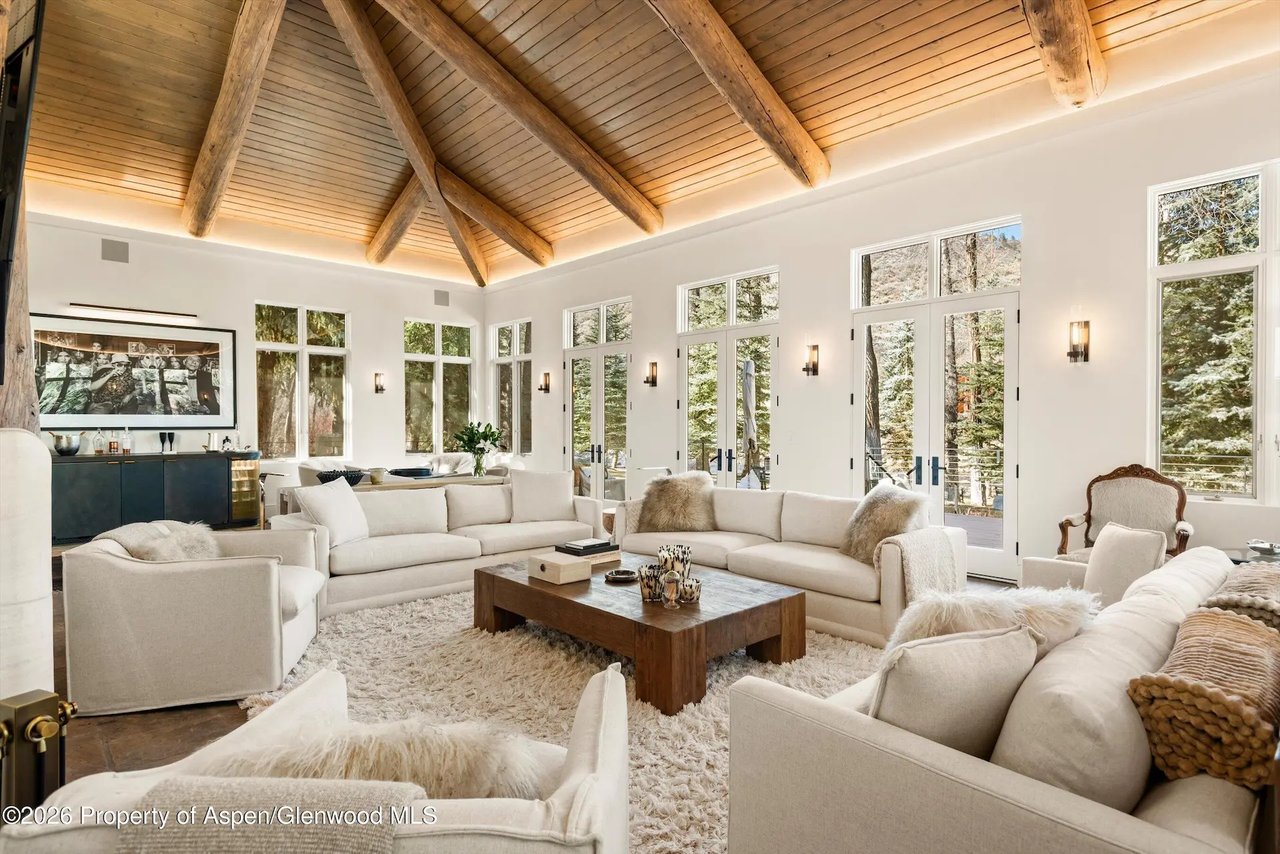
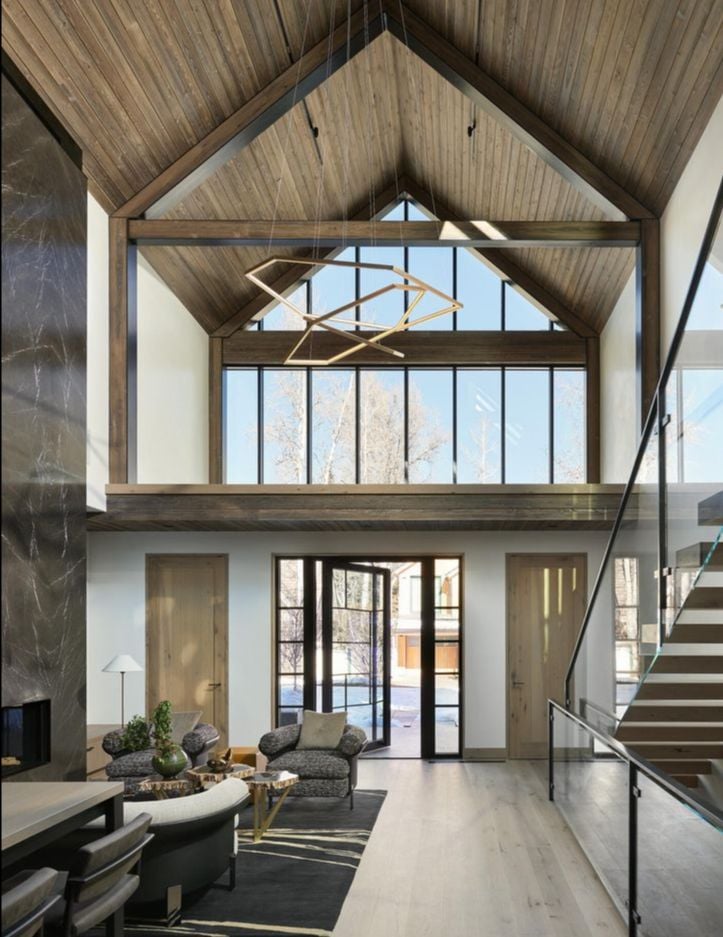
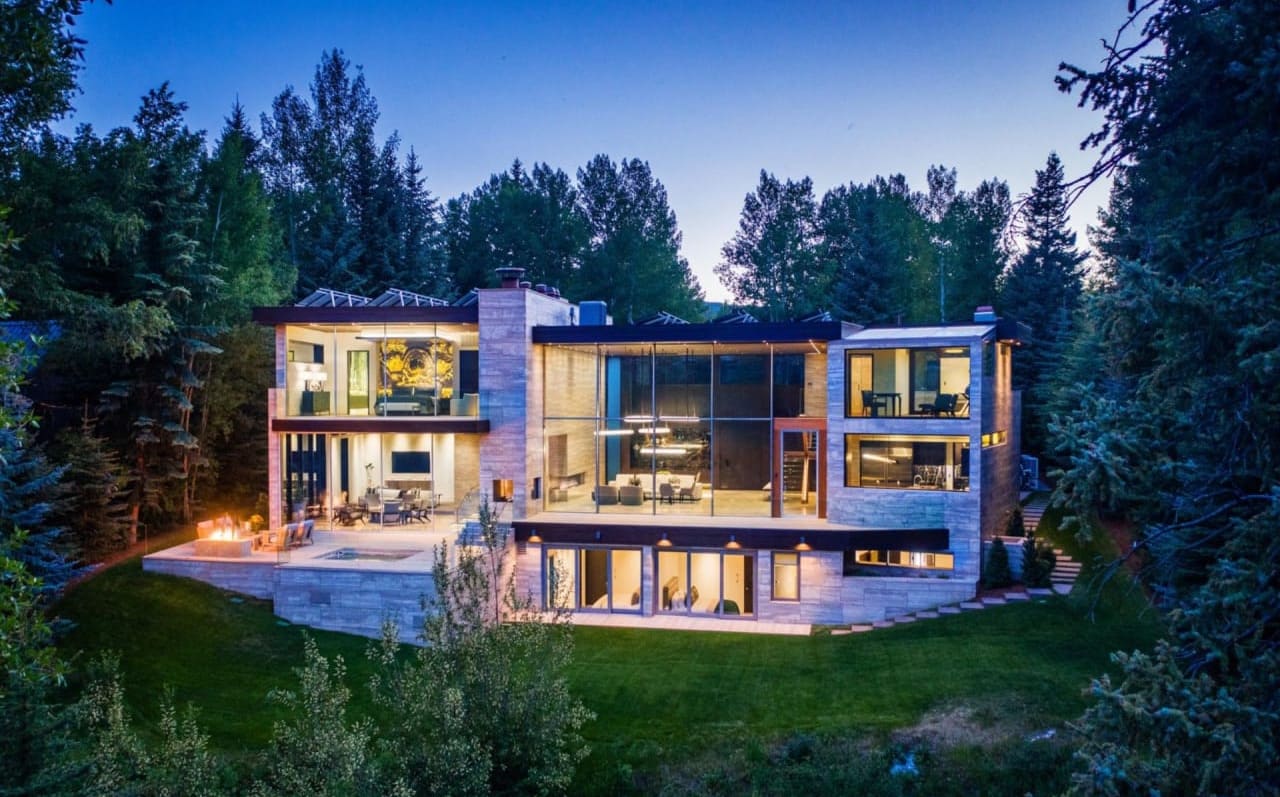
270 Heather Lane (photo with link above)
$53.5M | $7100/sq ft | Sold in April
7100 sq ft | 6 beds | 8 baths | 1 acre | Built in 2021
This was a record sale on a price per square foot basis in the Meadowood neighborhood, which is a 5 min drive from the Core. The home is a spectacular and build and design with expansive living spaces and lots of light.
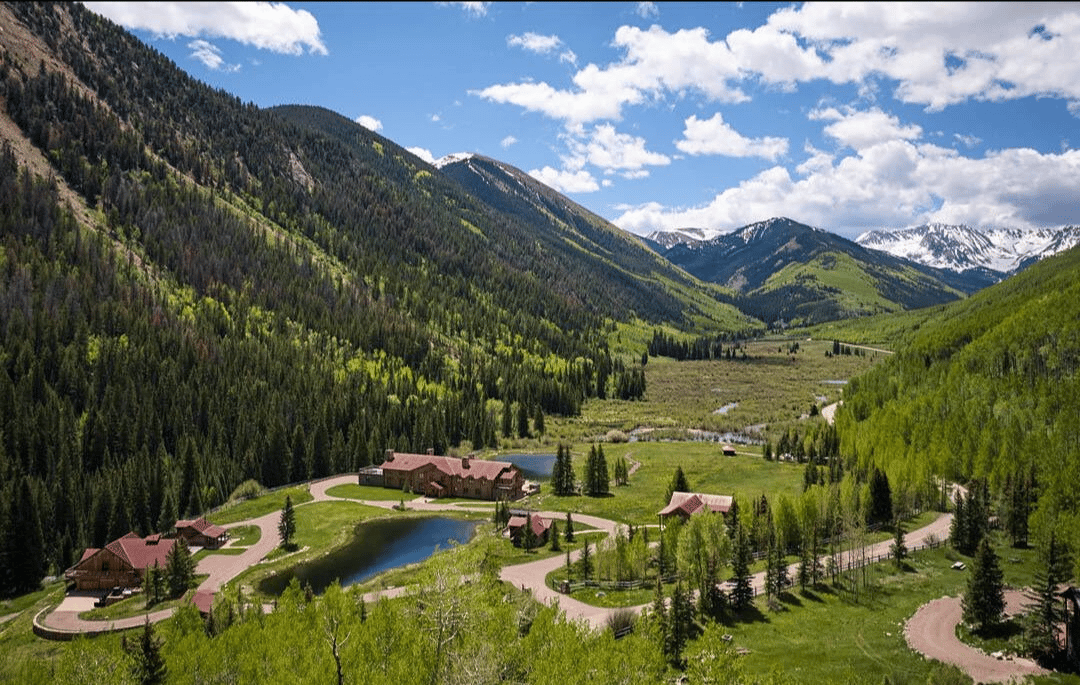
433 Running Mare Rd
$58M | $4400/sq ft | Sold in April
8,000 sq ft main home and 5,000 sq ft guest home | 16 acres | Built in 2001
A ranch in Woody Creek.
|
|
|
|
|
|
|
|
|
|
|
|
|
How to Sell your Home and Keep your Privacy
|
|
|
|
Many Aspen buyers would like to test the market to see if they can get one of these record setting prices for their homes but are concerned with privacy and don’t want it in the MLS or on other websites for the whole world to see.
Insider Aspen has an elegant solution for that. We have have partnered up with James Edition, which is where the world’s billionaires and millionaires go to find their next villa to buy or to rent, yacht, jet, sports car, high end watches, jewelry and collectibles.
Below you will find some stats on their worldwide reach and the brands who are on there.
|
|
|
|
|
|
They have 700,000 qualified buyers all over the world receiving their weekly newsletter with the newest additions to their properties and a total of 500,000 luxury listings worldwide.
If you want to your home to be exposed to only qualified buyers, this is the place to be.
|
|
|
|
|
|
|
|
|
|
|
|
|
|
If you choose to showcase your home on their website with Insider Aspen, you also get access to a feature article on your home like this that goes into their online Journal increasing the chances that your home will be seen by affluent buyers.
|
|
|
|
The best part is that we do not have to share the address of your home and it does not have to go into the MLS, ensuring that your privacy is protected and you get the “off market” treatment with a targeted exposure.
|
|
|
|
All we need are professional photos of your home and a description to put your home in front of the most qualified buyers, at no cost to you. There is no long term commitment, so please reach out if you are curious about what you could get for your home in this market.
|
|
|
|
This is an example of their newsletter that goes out to all their buyers and out on their social media accounts. They also put together a global real estate market report. Here you can see the 2024 Edition.
|
|
|
|
|
2000 Leagues under the Sea
|
|
|
|
If you are like me and you grew up watching Jacques Cousteau documentaries, reading Jules Verne’s “2,000 Leagues under the Sea” and dreaming of becoming a marine biologist, you will love these short films on Beneath the Surface that Y.CO puts together for their clients.
Founded by two gentlemen from Monaco who have a passion for superyachts and classic car racing, their yacht company is now trusted with the management of some of the largest yachts in the world.
I met their team in Aspen and really enjoyed their family spirit.
They still have some incredible last minute summer yachts for charter. If you feel like you have seen the world, their inspiration guides have plenty of fresh ideas for your next yacht trip.
Feel free to reach out to me if you would like to be connected with their wonderful team for your next yacht charter.
|
|
|
|
|
|
|
We all know that rental income is taxable. What if you could use your pre-tax dollars to travel the world…
If you are open to renting your home to other wealthy home owners, instead of receiving income you could be receiving credits to use on your stays at other people’s homes, just like you.
Click here to see the type of properties you could stay at if you put up your rental home for at least 2 weeks a year. You can even exchange it for a yacht or an island!
Click on the images above and below to see the incredible properties you can visit.
|
|
|
|
|
|
The key with putting your Aspen rental property in their pool is that your exchange keys (credits) are based on the value of your home. Since the values in Aspen are so high, even if you have a condo here, you can probably exchange it for a villa in Italy!
To book a stay in exchange, you just pay a weekly fee which ranges from $495 to $3,000 for massive villas, which is like getting 90% off the full rental rate.
I spent an incredible week in St John with my girlfriend at this luxurious villa for just $800 per week ($400/person!).
|
|
|
|
|
|
As my client you get a waived $2,500 initiation fee and 5 Keys to book your first vacation - a $7,500 value.
I love using their program, so please reach out if I can walk you through it.
If you are ready to start traveling the smart way, click here.
|
|
|
|
|
|
|
If you are like most Aspen locals, you love supporting laudable causes. This one is promising to be the most anticipated event of the year. I was honored to be a part of the committee to help raise money for the National Jewish Health, which is one the leading secular hospitals in the world for treating respiratory, immune and cardiac issues.
Out of their 125 years, they have provided free care for 75 years and continue to provide subsidized care to adults and children who cannot afford it. They have a free school center for kids while they are undergoing treatment.
This year they are putting on a show called - Rev the Runway, sponsored by Bentley and Modern Luxury. It’s a professional fashion show featuring outfits from local boutiques. More info here.
It is one of the most fun and lively events of the year. This year they are honoring the Gorsuch Family. Many exciting sponsors are participating and the auction packages are quiet remarkable. As an example, Kiton is offering a fabulous stay in Naples, Italy and a tour of their factory (valued at $20,000).
Here is a video of the event from 2024.
Tell all your friends and come for the biggest show and party of the summer!
|
|
|
|
|
|
|
|
Don’t forget to enjoy my favorite classical music concerts this summer.
Sunny wishes from Aspen!
Ksenia Tyutrina
Owner Broker
970-355-8734
[email protected]
|
|
|
|
|
|
|
|
|
|
|
|
|
|
|
If you are looking for off market Aspen homes over $10M, please reach out for a list of 80 homes.
|
|
|
|
|
|